Crime statistics help measure the safety, governance, and social conditions of a country. In India, crime data is officially published by the National Crime Records Bureau (NCRB) under the Ministry of Home Affairs. This blog provides a state-wise and category-wise analysis of crime in India, based on officially reported NCRB data.
What Is Crime Rate in India?
Crime rate refers to the number of cognizable crimes registered per one lakh population. This method allows fair comparison between states with different population sizes. A higher crime rate does not always indicate higher criminal activity; in many cases, it reflects better reporting and law enforcement efficiency.
State-Wise Crime Rate in India
Below is the ranking of Indian states and union territories based on overall crime rate per lakh population.
Overall Crime Rate – State and UT Wise
| Rank | State / UT | Crime Rate (Per Lakh Population) |
|---|---|---|
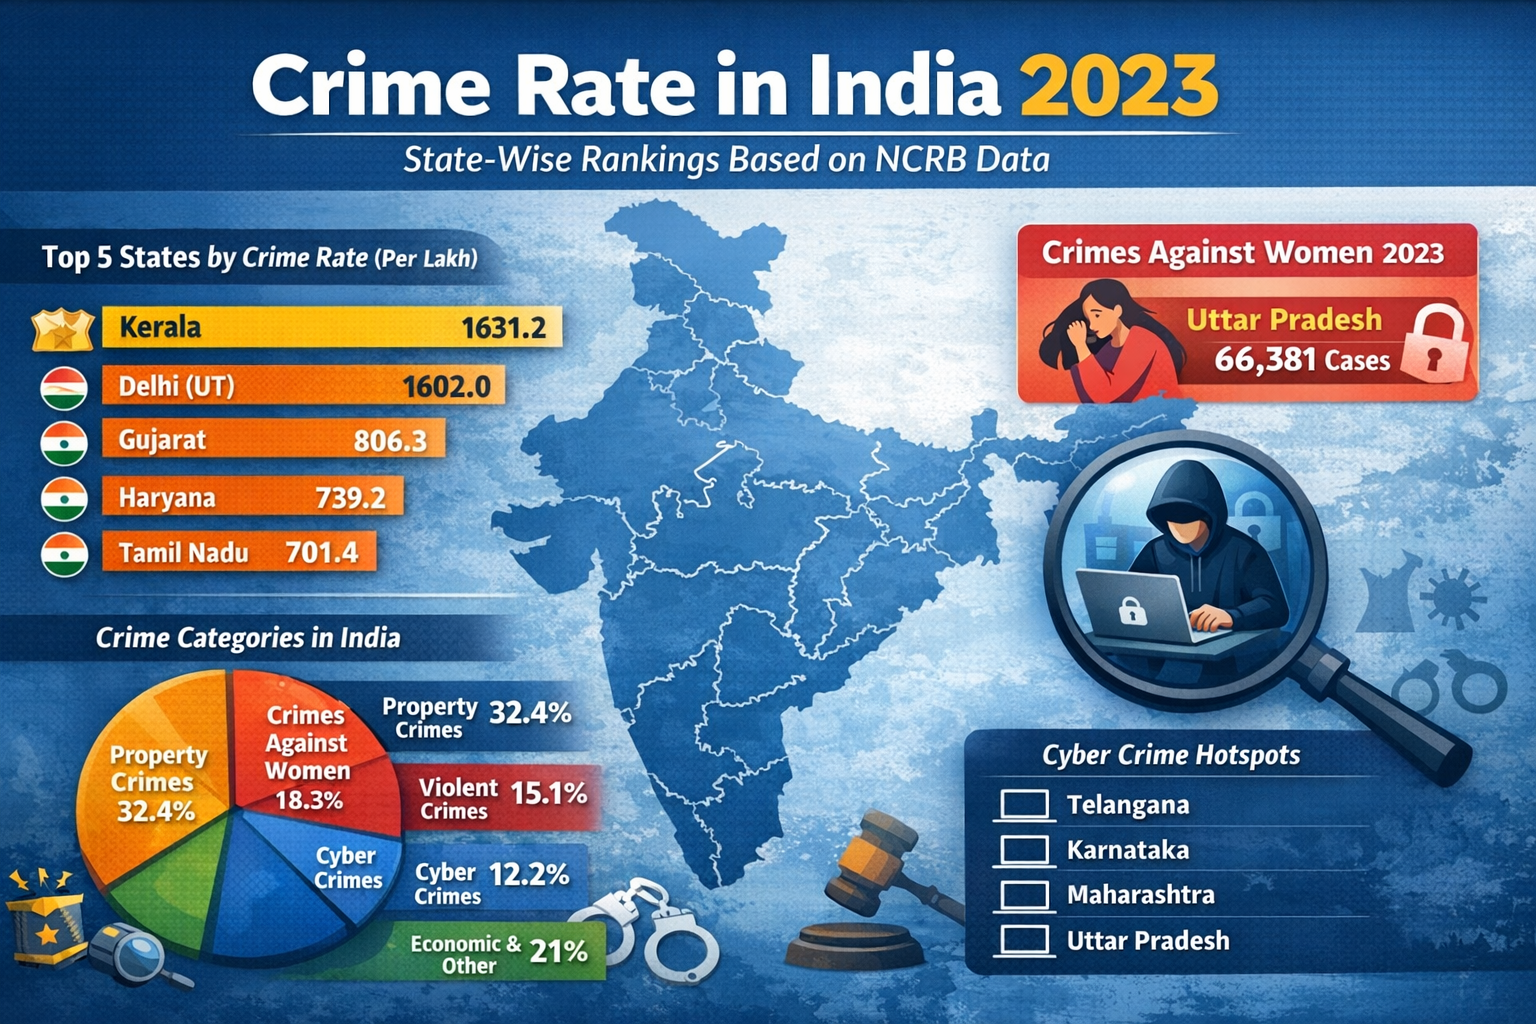
| 1 | Kerala | 1631.2 |
| 2 | Delhi (UT) | 1602.0 |
| 3 | Gujarat | 806.3 |
| 4 | Haryana | 739.2 |
| 5 | Tamil Nadu | 701.4 |
| 6 | Manipur | 627.8 |
| 7 | Madhya Pradesh | 569.3 |
| 8 | Maharashtra | 470.4 |
| 9 | Chhattisgarh | 404.2 |
| 10 | Rajasthan | 388.8 |
| 11 | Odisha | 386.7 |
| 12 | Assam | 379.0 |
| 13 | Andhra Pradesh | 346.3 |
| 14 | Uttar Pradesh | 335.3 |
| 15 | Karnataka | 268.1 |
| 16 | Himachal Pradesh | 256.0 |
| 17 | Punjab | 240.6 |
| 18 | Arunachal Pradesh | 178.0 |
| 19 | Jharkhand | 164.5 |
| 20 | Nagaland | 71.8 |
Crimes Against Women in India
Crimes against women include domestic violence, sexual offences, harassment, and dowry-related cases. This category remains one of the most critical indicators of social safety.

Top States by Total Crimes Against Women
| Rank | State | Total Cases |
|---|---|---|
| 1 | Uttar Pradesh | 66,381 |
| 2 | Maharashtra | 47,101 |
| 3 | Rajasthan | 45,450 |
| 4 | West Bengal | 34,691 |
| 5 | Madhya Pradesh | 32,342 |
Crime Rate Against Women (Per Lakh Female Population)
| Rank | State | Crime Rate |
|---|---|---|
| 1 | Telangana | 124.9 |
| 2 | Rajasthan | 114.8 |
| 3 | Odisha | 112.4 |
| 4 | Haryana | 110.3 |
| 5 | Kerala | 86.1 |
Category-Wise Crime in India
Crimes in India are classified under the Indian Penal Code (IPC) and Special and Local Laws (SLL).
Major Crime Categories and Their Share
| Crime Category | Share (%) |
|---|---|
| Property Crimes | 32.4% |
| Crimes Against Women | 18.3% |
| Violent Crimes | 15.1% |
| Cyber Crimes | 12.2% |
| Economic Crimes | 11.7% |
| Other IPC Crimes | 10.3% |
Property crimes such as theft and burglary account for the largest portion of reported crimes in India.
Cyber Crime in India
Cyber crime has emerged as one of the fastest-growing crime categories due to increased internet usage, digital payments, and online services.
States with High Cyber Crime Reporting
| Rank | State | Reporting Level |
|---|---|---|
| 1 | Telangana | High |
| 2 | Karnataka | High |
| 3 | Maharashtra | High |
| 4 | Uttar Pradesh | Moderate |
| 5 | Delhi (UT) | Moderate |
Conclusion
Official NCRB crime data provides a reliable and structured understanding of crime patterns in India. State-wise and category-wise analysis highlights the impact of population size, urbanization, and reporting practices on crime statistics. Proper interpretation of this data helps policymakers, researchers, and citizens work toward better law enforcement, awareness, and social safety.


A_qxsl
“Если вы ищете полезный seo блог для копирайтеров, то этот ресурс станет вашим надежным помощником в изучении и применении SEO-стратегий.”
Выбирайте узкую нишу, чтобы легче привлекать целевую аудиторию. Это позволит быстрее выйти в топ поисковиков. Используйте сервисы вроде Google Keyword Planner для оценки спроса.
Не менее важно учитывать свою экспертность в выбранной области. Если вы разбираетесь в теме, контент будет более качественным.
#### **2. Оптимизация контента под поисковые системы**
SEO-оптимизация — ключевой фактор продвижения блога. Следите за плотностью ключевых фраз, чтобы не переспамить текст. Также важно работать с метатегами. Title и Description влияют на кликабельность в выдаче.
Структура текста тоже играет роль. Используйте списки и таблицы для удобства чтения.
#### **3. Продвижение и привлечение трафика**
Без продвижения даже качественный контент останется незамеченным. Используйте соцсети для привлечения первой аудитории.
Еще один эффективный метод — внутренняя перелинковка. Грамотная перелинковка улучшает индексацию страниц.
#### **4. Монетизация SEO блога**
Когда блог набирает трафик, можно задуматься о заработке. Продажа рекламных мест напрямую выгодна при высокой посещаемости.
Дополнительные возможности включают инфопродукты. Создайте платные курсы или гайды по своей нише.
—
#### **1. Выбор ниши для SEO блога**
Экспертность повышает доверие читателей и снижает отказы.
#### **2. Оптимизация контента под поисковые системы**
Используйте LSI-слова для естественного вхождения ключей.
#### **3. Продвижение и привлечение трафика**
Используйте соцсети для привлечения первой аудитории.
#### **4. Монетизация SEO блога**
Контекстная реклама (AdSense, РСЯ) — простой способ монетизации.